Rendering images in matplotlib
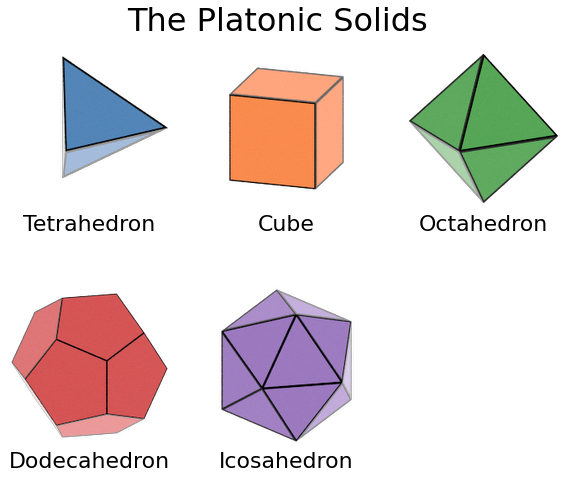
Images rendered by fresnel can be converted to RGBA arrays for display with the imshow command in matplotlib. This example shows how to build subplots that display the geometries of the Platonic Solids.
[1]:
import numpy as np
import fresnel
import matplotlib
import matplotlib.pyplot as plt
[2]:
platonic_solid_vertices = {
    'Tetrahedron': [
        [0.0, 0.0, 0.612372],
        [-0.288675, -0.5, -0.204124],
        [-0.288675, 0.5, -0.204124],
        [0.57735, 0.0, -0.204124]],
    'Cube': [
        [-0.5, -0.5, -0.5],
        [-0.5, -0.5, 0.5],
        [-0.5, 0.5, -0.5],
        [-0.5, 0.5, 0.5],
        [0.5, -0.5, -0.5],
        [0.5, -0.5, 0.5],
        [0.5, 0.5, -0.5],
        [0.5, 0.5, 0.5]],
    'Octahedron': [
        [-0.707107, 0.0, 0.0],
        [0.0, 0.707107, 0.0],
        [0.0, 0.0, -0.707107],
        [0.0, 0.0, 0.707107],
        [0.0, -0.707107, 0.0],
        [0.707107, 0.0, 0.0]],
    'Dodecahedron': [
        [-1.37638, 0.0, 0.262866],
        [1.37638, 0.0, -0.262866],
        [-0.425325, -1.30902, 0.262866],
        [-0.425325, 1.30902, 0.262866],
        [1.11352, -0.809017, 0.262866],
        [1.11352, 0.809017, 0.262866],
        [-0.262866, -0.809017, 1.11352],
        [-0.262866, 0.809017, 1.11352],
        [-0.688191, -0.5, -1.11352],
        [-0.688191, 0.5, -1.11352],
        [0.688191, -0.5, 1.11352],
        [0.688191, 0.5, 1.11352],
        [0.850651, 0.0, -1.11352],
        [-1.11352, -0.809017, -0.262866],
        [-1.11352, 0.809017, -0.262866],
        [-0.850651, 0.0, 1.11352],
        [0.262866, -0.809017, -1.11352],
        [0.262866, 0.809017, -1.11352],
        [0.425325, -1.30902, -0.262866],
        [0.425325, 1.30902, -0.262866]],
    'Icosahedron': [
        [0.0, 0.0, -0.951057],
        [0.0, 0.0, 0.951057],
        [-0.850651, 0.0, -0.425325],
        [0.850651, 0.0, 0.425325],
        [0.688191, -0.5, -0.425325],
        [0.688191, 0.5, -0.425325],
        [-0.688191, -0.5, 0.425325],
        [-0.688191, 0.5, 0.425325],
        [-0.262866, -0.809017, -0.425325],
        [-0.262866, 0.809017, -0.425325],
        [0.262866, -0.809017, 0.425325],
        [0.262866, 0.809017, 0.425325]],
    }
The render function returns a NumPy array of the output buffer, which can be passed directly to imshow.
[3]:
def render(shape, color_id=0):
    verts = platonic_solid_vertices[shape]
    scene = fresnel.Scene(fresnel.Device(mode='cpu'))
    scene.lights = fresnel.light.lightbox()
    poly_info = fresnel.util.convex_polyhedron_from_vertices(verts)
    cmap = matplotlib.cm.get_cmap('tab10')
    geometry = fresnel.geometry.ConvexPolyhedron(
        scene, poly_info,
        position = [0, 0, 0],
        orientation = [0.975528, 0.154508, -0.154508, -0.024472],
        outline_width = 0.015)
    geometry.material = fresnel.material.Material(
        color = fresnel.color.linear(cmap(color_id)[:3]),
        roughness = 0.1,
        specular = 1)
    geometry.outline_material = fresnel.material.Material(
        color = (0., 0., 0.),
        roughness = 0.1,
        metal = 1.0)

    scene.camera = fresnel.camera.Orthographic.fit(scene, view='front')
    out = fresnel.pathtrace(scene, samples=64,
                            light_samples=32,
                            w=200, h=200)
    return out[:]
Below, imshow is used to render one scene in each subplot. Specifying an interpolation with imshow improves image quality.
[4]:
def show_shape(shape, location, color_id):
    ax = axs[location]
    ax.imshow(render(shape, color_id), interpolation='lanczos')
    ax.set_xlabel(shape, fontsize=22)

fig, axs = plt.subplots(ncols=3, nrows=2, figsize=(10, 8))

show_shape('Tetrahedron', (0, 0), 0)
show_shape('Cube', (0, 1), 1)
show_shape('Octahedron', (0, 2), 2)
show_shape('Dodecahedron', (1, 0), 3)
show_shape('Icosahedron', (1, 1), 4)

for ax in axs.flatten():
    ax.set_xticks([])
    ax.set_yticks([])
    ax.spines['right'].set_visible(False)
    ax.spines['top'].set_visible(False)
    ax.spines['bottom'].set_visible(False)
    ax.spines['left'].set_visible(False)

fig.suptitle('The Platonic Solids', y=0.92, fontsize=32)
plt.show()